Q: What is interdependence analysis in statistics?
A:
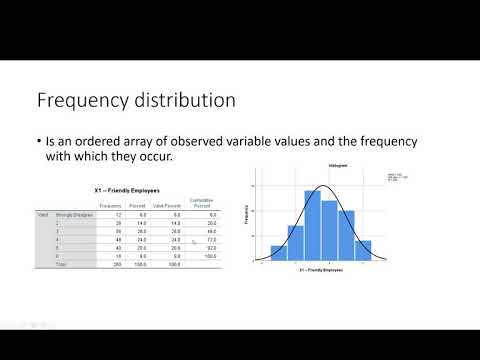
- 📊 Interdependence analysis, also known as interdependency analysis, examines the relationships and dependencies among multiple variables in a dataset.
- 📈 It aims to identify patterns of interrelatedness, co-occurrence, or mutual influence between variables, providing insights into the underlying structure of the data.
Q: Why is interdependence analysis important in data analysis?
A:
- 🎯 Interdependence analysis helps researchers understand the complex interactions and dependencies among variables, guiding the exploration of underlying patterns or structures in the data.
- 📊 It facilitates the identification of key variables, factors, or clusters that contribute to the overall variation or behavior observed in the dataset.
- 💡 Interdependence analysis informs hypothesis testing, model building, and decision-making by revealing associations, correlations, or causal relationships among variables.
Q: What are the common methods of interdependence analysis?
A:
- 📉 Correlation Analysis: Measures the strength and direction of linear relationships between pairs of continuous variables.
- 📊 Covariance Analysis: Examines the extent to which two variables vary together, regardless of their scale or units of measurement.
- 📈 Factor Analysis: Identifies latent factors or constructs that explain patterns of correlations among observed variables.
- 💡 Structural Equation Modeling (SEM): Evaluates complex networks of relationships among multiple variables, including direct and indirect effects.
- 📊 Cluster Analysis: Groups variables into clusters based on similarity or proximity, revealing patterns of association or dissimilarity.
Q: How is interdependence analysis performed and interpreted?
A:
- 📉 Data Preparation: Organize and preprocess the data, ensuring consistency in measurement scales and addressing missing values or outliers.
- 📊 Exploratory Analysis: Conduct exploratory data analysis to visualize relationships between variables using scatter plots, correlation matrices, or heatmaps.
- 📈 Statistical Techniques: Apply appropriate statistical techniques such as correlation analysis, factor analysis, or structural equation modeling to quantify and interpret interdependencies among variables.
- 💡 Interpretation: Interpret the results of interdependence analysis in the context of research objectives, theoretical frameworks, or practical implications, considering the strength, direction, and significance of relationships.
Q: How can interdependence analysis findings be applied in research or decision-making?
A:
- 🎯 Variable Selection: Identify key variables or predictors that contribute most significantly to the variation or outcomes of interest.
- 📊 Model Building: Inform the development of predictive models, causal models, or structural models by incorporating insights from interdependence analysis.
- 📈 Hypothesis Testing: Test hypotheses about the relationships or associations between variables based on empirical evidence derived from interdependence analysis.
- 💡 Decision Support: Provide evidence-based recommendations or insights for decision-making in various domains, including healthcare, finance, marketing, and social sciences.
In summary, interdependence analysis is a valuable approach for exploring and understanding the complex relationships and dependencies among variables in a dataset. By applying appropriate statistical techniques and interpreting the results thoughtfully, researchers can uncover meaningful patterns, associations, or structures that enhance their understanding of the data and inform decision-making processes.
-

statistical software tabulation business data processing
-

"Tabulation: An Essential Tool for Data Analysis" |Statistics lecture |@Educational Hub
-

What is Cross-Tabulation & How to do it? | Contingency or Cross Tabs
-
Data checking and tabulation
-

DATA PROCESSING & TABULATION
-
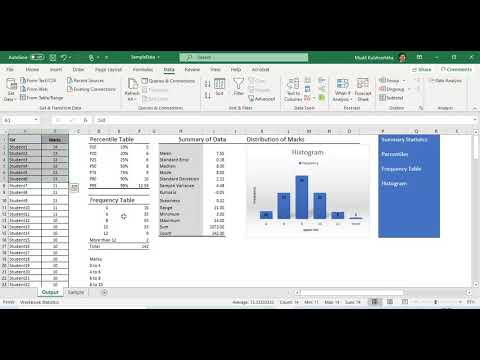
Statistics in Excel Tutorial 1.1. Descriptive Statistics using Microsoft Excel