Q: What is bivariate analysis in statistics?
A:
- 📊 Bivariate analysis is a statistical method used to explore the relationship between two variables simultaneously.
- 📉 It examines how changes in one variable are associated with changes in another variable, allowing researchers to assess the strength and direction of their relationship.
Q: Why is bivariate analysis important in data analysis?
A:
- 🎯 Bivariate analysis helps researchers understand the nature and strength of relationships between variables, informing hypotheses, theories, and further research directions.
- 📊 It provides insights into patterns of association, dependency, or causality between variables, facilitating evidence-based decision-making and problem-solving.
- 💡 Bivariate analysis serves as a foundation for more advanced multivariate analyses, allowing researchers to explore complex relationships involving multiple variables.
Q: What is correlation analysis in bivariate analysis?
A:
- 📈 Correlation analysis is a statistical technique used to measure the strength and direction of the linear relationship between two continuous variables.
- 📊 It quantifies the degree of association between variables, ranging from -1 (perfect negative correlation) to 1 (perfect positive correlation), with 0 indicating no correlation.
Q: Why is correlation analysis important in bivariate analysis?
A:
- 📉 Correlation analysis provides a numerical measure of the extent to which changes in one variable are accompanied by changes in another variable, allowing researchers to assess the strength and direction of their relationship.
- 📊 It helps researchers identify potential patterns, trends, or dependencies between variables, guiding further investigation and hypothesis testing.
- 💡 Correlation analysis informs decision-making in various domains, such as finance, economics, psychology, and healthcare, by uncovering associations and predicting outcomes.
Q: What are the common types of correlation coefficients used in correlation analysis?
A:
- 📈 Pearson correlation coefficient (r): Measures the strength and direction of the linear relationship between two continuous variables.
- 📊 Spearman’s rank correlation coefficient (ρ): Assesses the strength and direction of the monotonic relationship between two variables, regardless of their distributional properties.
- 📉 Kendall’s tau (τ): Estimates the strength and direction of the ordinal association between two variables, particularly when dealing with ranked or ordinal data.
Q: How is correlation analysis performed in practice?
A:
- 📊 Calculate the appropriate correlation coefficient (e.g., Pearson, Spearman, Kendall) based on the type and distributional properties of the variables.
- 📉 Interpret the correlation coefficient, considering its magnitude (strength) and sign (direction), as well as its statistical significance.
- 💡 Assess the robustness of the correlation analysis findings by considering potential confounding variables, outliers, or non-linear relationships.
- 📈 Visualize the relationship between variables using scatterplots or other graphical representations to complement numerical measures of correlation.
Q: How do researchers interpret the results of correlation analysis?
A:
- 📊 Determine the strength and direction of the correlation coefficient, ranging from -1 to 1, with higher absolute values indicating stronger relationships.
- 📉 Consider the statistical significance of the correlation coefficient, typically assessed using hypothesis tests or confidence intervals.
- 💡 Interpret the findings in the context of the research question, theoretical framework, and practical implications, recognizing that correlation does not imply causation.
- 🔄 Validate the results of correlation analysis through sensitivity analyses, robustness checks, or replication studies to ensure the reliability and reproducibility of findings.
In summary, bivariate analysis, particularly correlation analysis, is a powerful tool for exploring relationships between two variables, providing valuable insights into patterns of association, dependency, or causality in data. By understanding and interpreting correlation coefficients appropriately, researchers can make informed decisions and advance knowledge in their respective fields.
-
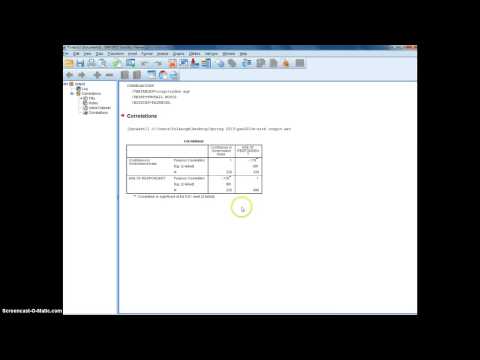
Tutorial-Bivariate Correlations in SPSS
-
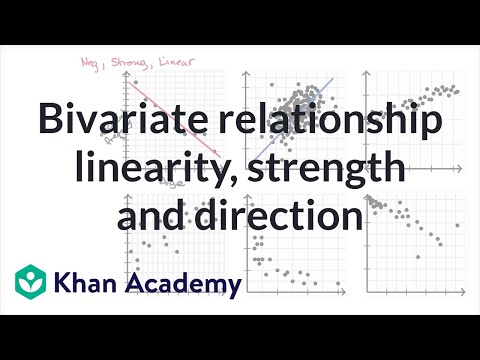
Bivariate relationship linearity, strength and direction | AP Statistics | Khan Academy
-
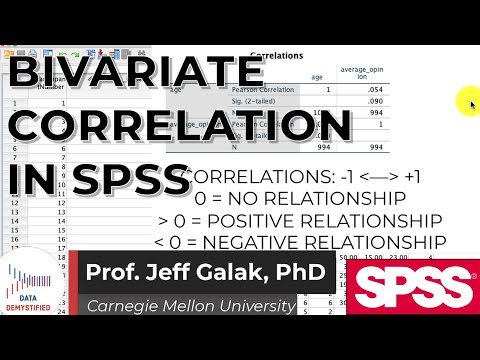
Bivariate Correlation in SPSS (SPSS Tutorial Video #15) - Pearson, Spearman, and Kendall's Tau-B
-

Tutorial 22-Univariate, Bivariate and Multivariate Analysis- Part1 (EDA)-Data Science
-
Correlation analysis
-
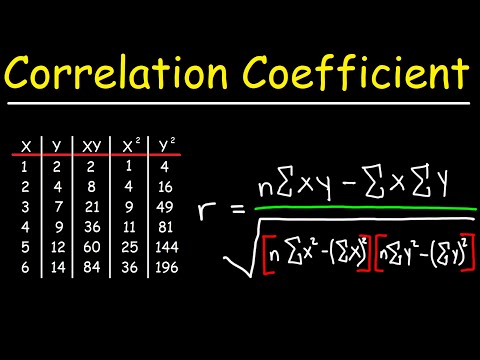
Correlation Coefficient