Q: What is ANOVA (Analysis of Variance) in statistics?
A:
- 📊 ANOVA, or Analysis of Variance, is a statistical technique used to compare means among three or more groups to determine if there are statistically significant differences between them.
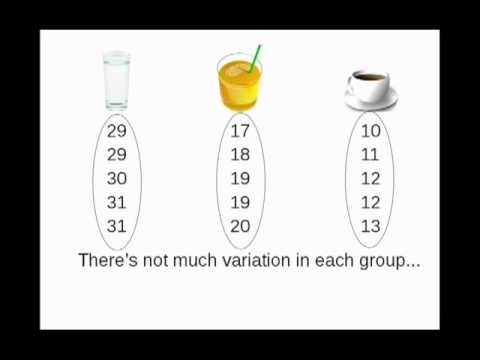
- 📈 It assesses the variation between group means relative to the variation within groups.
Q: Why is ANOVA important in data analysis?
A:
- 📉 ANOVA allows researchers to compare multiple groups efficiently, making it suitable for experiments with more than two treatment conditions.
- 📊 It provides insights into the factors or variables that may influence the outcome variable and helps identify significant differences among groups.
- 💡 ANOVA is widely used in various fields, including psychology, biology, economics, and social sciences, to analyze experimental data and draw conclusions about treatment effects or group differences.
Q: What are the key assumptions of ANOVA?
A:
- 📊 Independence: Observations within each group are independent of each other.
- 📈 Normality: The residuals (errors) of the model are normally distributed.
- 📉 Homogeneity of Variance: The variance of the outcome variable is approximately equal across all groups.
Q: What are the different types of ANOVA?
A:
- 📊 One-Way ANOVA: Compares means across three or more independent groups on a single factor or independent variable.
- 📈 Two-Way ANOVA: Analyzes the effects of two independent variables (factors) on the outcome variable and their interactions.
- 📉 Repeated Measures ANOVA: Compares means across three or more related groups, where participants are measured under multiple conditions or time points.
Q: How is ANOVA performed?
A:
- 📊 Calculate the overall mean and group means for each level of the independent variable.
- 📈 Compute the sum of squares (SS) for between-group variation and within-group variation.
- 📉 Calculate the F-statistic by dividing the between-group mean square by the within-group mean square.
- 📊 Determine the critical F-value and compare it to the computed F-value to assess statistical significance.
- 💡 Interpret the results and post-hoc tests to identify which group means differ significantly from each other.
Q: What are the implications of ANOVA results?
A:
- 📈 Significant results indicate that there is at least one statistically significant difference among the group means.
- 📊 Post-hoc tests can help identify specific group differences and provide more detailed insights into the nature of the differences.
- 📉 Effect size measures, such as eta-squared or partial eta-squared, can quantify the magnitude of group differences and their practical significance.
- 💡 ANOVA results can inform subsequent analyses, interpretation of study findings, and recommendations for future research or interventions.
In summary, ANOVA is a powerful statistical tool for comparing means across multiple groups and identifying significant differences, making it a valuable technique in experimental design, data analysis, and hypothesis testing.
ANOVA (Analysis of variance) simply explained
The ANOVA (Analysis of Variance) checks whether there are statistically significant differences between more than two groups.
QUALITATIVE RESEARCH: IMPORTANCE IN MANAGEMENTQ: Why is qualitative research important in management? A: 🎯 Understanding Complexity: Qualitative research helps managers understand the complex dynamics of organizational behavior, culture, and decision-making processes. 📊 Exploring Perspectives: It…
MARKET RESEARCH AND MARKETING RESEARCHMARKET RESEARCH AND MARKETING RESEARCH Question: What is Market Research? Answer: Definition: Market research involves the systematic gathering, recording, and analysis of data related to a particular market, including its size,…
MANAGEMENT RESEARCH PROCESS📊 MANAGEMENT RESEARCH PROCESS Q: What is the Management Research Process? A: The management research process refers to the systematic steps followed by researchers to conduct investigations, gather data, analyze findings,…
- MULTIVARIATE ANALYSIS: MULTIPLE REGRESSION Q: What is multivariate analysis in statistics? A: 📊 Multivariate analysis is a statistical method used to analyze and understand the relationships between multiple variables simultaneously. 📈 It explores complex interactions…
- SIMPLE LINEAR REGRESSION Q: What is bivariate analysis in statistics? A: 📊 Bivariate analysis is a statistical method used to explore and assess the relationship between two variables. 📈 It involves examining the association,…
- BIVARIATE ANALYSIS: CORRELATION Q: What is bivariate analysis in statistics? A: 📊 Bivariate analysis is a statistical method used to explore the relationship between two variables simultaneously. 📉 It examines how changes in one…
- PRACTICAL: APPLICATION OF STATISTICAL SOFTWARE PACKAGES FOR TABULATION AND ANALYSIS OF DATA Q: What is interdependence analysis in statistics? A: 📊 Interdependence analysis, also known as interdependency analysis, examines the relationships and dependencies among multiple variables in a dataset. 📈 It aims to…
- HYPOTHESIS TESTING IN RESEARCH Q: What is hypothesis testing in statistics? A: 📊 Hypothesis testing is a statistical method used to make inferences or draw conclusions about population parameters based on sample data. 📈 It…
- ANALYTICAL DESIGN IN MANAGEMENT RESEARCH Q: What is an analytical design in management research, and what are some common analytical approaches used by researchers? A: Navigating Analytical Design in Management Research Introduction: Analytical design refers to…
- TABULATION AND ANALYSIS OF DATA Q: What are tabulation and data analysis techniques commonly employed in management research, and how do researchers conduct these processes effectively? A: Navigating Tabulation and Data Analysis in Management Research Introduction:…
- REPERTORY GRID Q: What is the Repertory Grid technique in management research? A: 🎯 The Repertory Grid technique is a qualitative research method used to elicit and analyze the personal constructs or dimensions…
- UNIVARIATE ANALYSIS: PARAMETRIC AND NON-PARAMETRIC TESTS Q: What is univariate analysis in statistics? A: 📊 Univariate analysis focuses on analyzing and summarizing the distribution and characteristics of a single variable at a time. 📈 It involves examining…
- CHI-SQUARE TESTS Q: What is the chi-square test in statistics? A: 📊 The chi-square test is a statistical method used to determine whether there is a significant association between categorical variables in a…
- INTERDEPENDENCE ANALYSIS Q: What is interdependence analysis in statistics? A: 📊 Interdependence analysis, also known as multivariate analysis, examines the relationships and interactions between multiple variables within a dataset. 📈 It explores how…
- RESEARCH DESIGNS: APPLICABILITY OF SPECIFIC DESIGNS Q: What is the significance of research in management? A: 📊 Research in management is essential for understanding and addressing complex organizational challenges, informing evidence-based decision-making, and driving organizational improvement and…
- COLLECTION OF DATA IN THE CONTEXT OF RESEARCH Q: What is data and information in the context of research? A: 📊 Data refers to raw facts, observations, or measurements collected during the research process, whereas information is data that…
- CENTRAL TENDENCY AND DISPERSION IN RESEARCH Q: What is central tendency in statistics? A: 📊 Central tendency refers to a statistical measure that represents the center or typical value of a distribution of data points. 🎯 It…
Powered by Contextual Related Posts


![One-Way ANOVA [Analysis of Variance] simply explained](../vi/mOdYddj5IG8/hqdefault.jpg)